Free Vector File: 100+ Infographic Elements
The free vector file this week is absolutely amazing. If you want to create your own infographics, there’s no need to reinvent the wheel. Today’s free vector file contains over 100 infographic elements. There are so many parts and pieces, that I doubt this set is missing anything that you need. The best part is that this free vector file is in native Illustrator format, so you can just bring it directly into Adobe Illustrator and get to work. below are some shots of today’s free vector file.
Circle Charts, Bar Graphics & Ribbons

With circular elements and line graphs, you’ll be able to show off quantitative data with style.
3D Bar Graphs, Plot graphs, Maps

The skewed 3D bar graphs are great for 3-4 pieces of information that you want to show in a small space. The grid map is great for plotting coordinates and the plot point graph is great for tracking figures over time.
Large Bar Graphs, Pie Charts
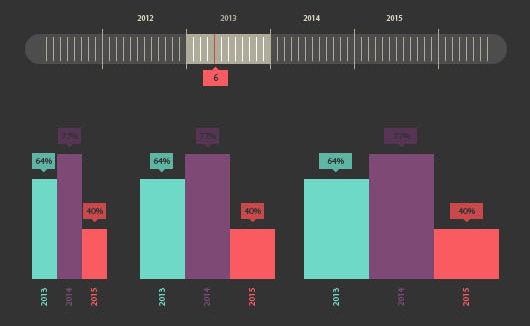
The line graph is excellent for highlighting a range of numbers. The thick solid bar graphs show a lot of emphasis on numbers.
Circles & Figures
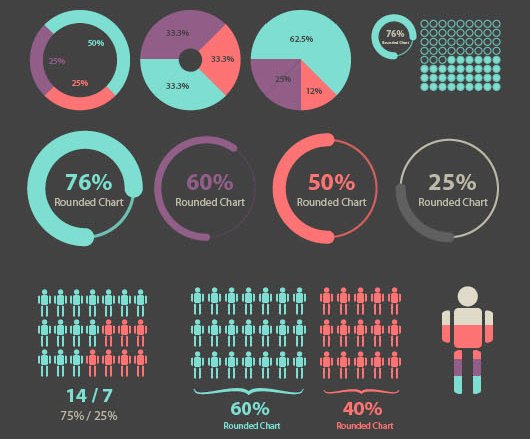
Need to show an amount of people? Use these figures to show off human data. There are also some circular charts and flat pie charts to help you with that.
Map & Tool Tips

This map is excellent for showing region-specific information using simplistic tool tips.
Line Graphs, 3D Bar Graphs
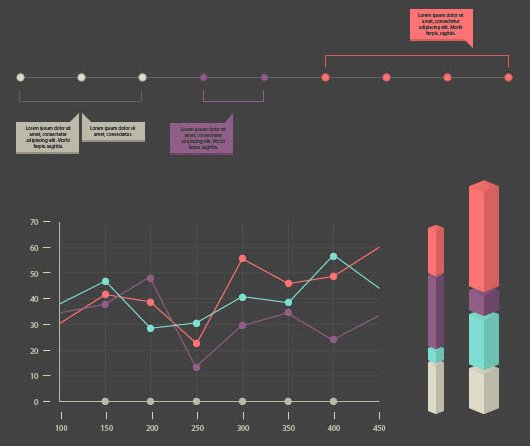
Here, you can see the different line graphs and 3D vertical bar graphs. These are definitely beautiful and creative ways to show data for multiple variables.
Circles With Shading & Vertical Gauges

These circular elements have a lot of visual contrast, due to the solid circles and the shaded empty areas.
Diagrams & More Bar Graphs

These diagrams and informational elements are great for showing simple data.
Circular Elements & Plot Graphs

The circle chart & pie chart overlay combo really emphasizes the differences in data. Using a central icon instantly tells you what the data is mainly about.
Flow Charts

Use these flow charts to lead visitors from section to section, making sequential data easy and fun to understand.
Stacked Elements

These stacked elements add an extra element to data with their 3-dimensional qualities.
Icon Sets

A set of flat icon sets for simple data and visual representation.
Circle Flow Chart
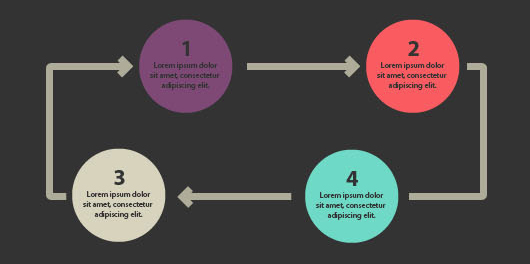
A flow chart with circular elements and solid lines. Being numbers makes sure that your viewers know where to begin and where to end.
Arrows & Shapes

Showing arrows in a different light, these elements and shapes work together to separate data, while still looking unified.
Tech Trees & 3D Bar Graphs
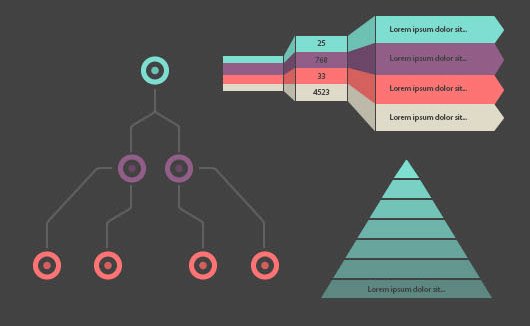
Need to show a tree of information? Use these elements to break down information. The 3 dimensional bar graph makes simple data interesting.
3D Pie Chart
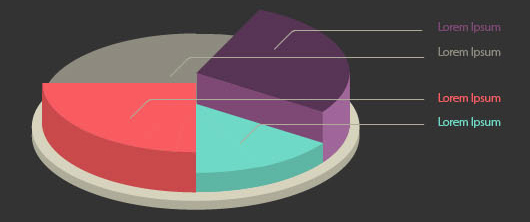
This 3D pie chart uses color and vertical height to emphasize the difference in data.
Cylindrical Bar Graphs
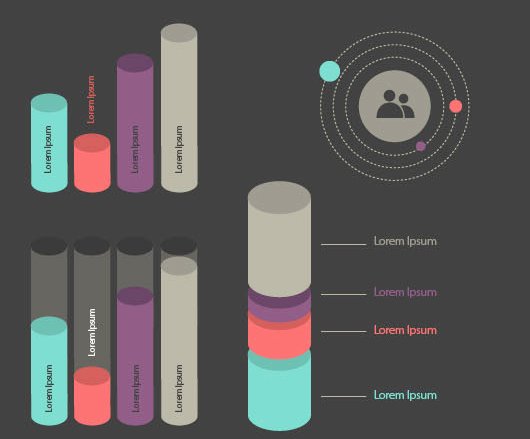
These 3D cylindrical elements are unique and really break down multifaceted types of information in a visually compelling way.
Conclusion
This week’s free vector file is an excellent source of infographic elements for your quality infographic designs. With several uniquely designed elements, these free vector elements can suit the needs of any infographic. It has a wide array of elements to visualize data. What will you use these free vector infographic elements for? Click the download button below to be taken to the download page.